What is Volatility Skew in Options Trading?
Volatility Skew - Definition
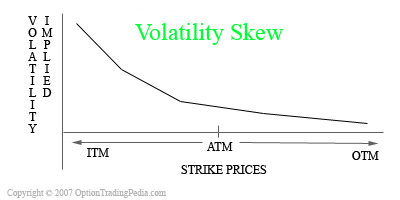
A graphical characteristic of the implied volatility of options of the same underlying asset across different strikes forming a right skewed curve.
What Is Volatility Skew?
Volatility Skew is one of two curve shapes formed by charting the implied volatility of options across the various strike prices. The other shape is the Volatility Smile. Basically, what the volatility Skew shows is that implied volatility is higher as the options go more and more In The Money (ITM), forming a right skewed curve, hence the name Volatility Skew. A Volatility Skew can also skew to the left, indicating higher implied volatilities for Out Of The Money (OTM) Options.

Similar to the Volatility Smile, any assets with options displaying a Volatility Skew is displaying inconsistency with the theories of the Black-Scholes Model in terms of constant volatility and that higher demand exist for In The Money Options. Please Read Volatility Smile For Analysis Method Using Volatility Skews.
2 Types Of Volatility Skew
There are 2 ways to chart Volatility Skews; Time Skew and Strike Skew. Time Skew is where implied volatility of options of the same strike is charted across different expiration dates. This Volatility Skew shows the future volatility of a particular option and may be indicative of future expectations. Strike Skew is the most common type of Volatility Skew where implied volatility of options of the same expiration is charted across the various strike prices. The Strike Skew is also what the explanation on Volatility Skew is referring to on this page.

|
Don't Know If This Is The Right Option Strategy For You? Try our Option Strategy Selector! |
| Javascript Tree Menu |
Important Disclaimer : Options involve risk and are not suitable for all investors. Data and information is provided for informational purposes only, and is not intended for trading purposes. Neither www.optiontradingpedia.com, mastersoequity.com nor any of its data or content providers shall be liable for any errors, omissions, or delays in the content, or for any actions taken in reliance thereon. Data is deemed accurate but is not warranted or guaranteed. optiontradinpedia.com and mastersoequity.com are not a registered broker-dealer and does not endorse or recommend the services of any brokerage company. The brokerage company you select is solely responsible for its services to you. By accessing, viewing, or using this site in any way, you agree to be bound by the above conditions and disclaimers found on this site.
Copyright Warning : All contents and information presented here in www.optiontradingpedia.com are property of www.Optiontradingpedia.com and are not to be copied, redistributed or downloaded in any ways unless in accordance with our quoting policy. We have a comprehensive system to detect plagiarism and will take legal action against any individuals, websites or companies involved. We Take Our Copyright VERY Seriously!
Site Authored by