What is Volatility Smile in Options Trading?
Volatility Smile - Definition
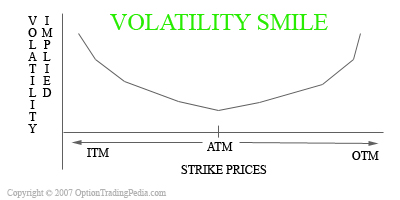
Graphical characteristic where the implied volatility of options based on the same underlying asset and expiring on the same day displays a U-shape across the various strike prices.
What Is Volatility Smile?
Volatility smile is one of two curve shapes formed by charting the implied volatility of options across the various strike prices. The other shape is the Volatility Skew. Basically, what the volatility smile shows is that implied volatility is higher as the options go more and more In The Money (ITM) and Out Of The Money (OTM), forming a curve in the shape of a smile, hence the term Volatility Smile.

 Volatility Smile is also sometimes
known as the Volatility Sneer or the Volatility Smirk. Volatility Smile is also sometimes
known as the Volatility Sneer or the Volatility Smirk.
|
The Volatility Smile is most prominent for near term equity options as well as forex options. What Volatility Smile is telling you as an options trader is that there is bigger option trading demand for In The Money (ITM) options and Out Of The Money (OTM) options than At The Money (ATM) options especially when speculative trades are heavy near to expiration. Such higher demand drives the extrinsic value of options upwards through an increase in implied volatility.
Volatility Smile & Implied Volatility
Implied volatility is one of 2 major price determinants of options in the Black-Scholes Model. The other major determinant is, of course, the price of the underlying asset. In fact, implied volatility is the main determinant of extrinsic value while the price of the underlying stock determines the intrinsic value. Implied volatility has been used as a tool by option trading market makers to balance the supply and demand of every options contracts since day one. When demand is high, market makers raise the implied volatility of that particular options contract in accordance to the forces of supply and demand, making a higher profit through a higher extrinsic value. When the implied volatilities of a particular options contract returns a volatility smile when charted, it tells you that both in the money and out of the money options are in huge demand and would contain more extrinsic value than would an At The Money option.
Volatility Smile & The Black-Scholes Model
Now, it is obvious that the Volatility Smile chart cannot be plotted without first finding out the implied volatility of the options across each strike price using an options pricing model such as the Black-Scholes Model. However, the resulting Volatility Smile does laugh at the fallacy of the Black-Scholes model in assuming that implied volatility is constant over time. The Volatility Smile shows that, in reality, implied volatility is different across different strike prices even for the same period of time.
Implications Of The Volatility Smile
Volatility Smiles suggests that as volatility in the overall market or in a particular stock increases, the chances of extreme price movements becomes highly possible, translating into a rush for Out of The Money Options for speculators and In The Money Options for value investors. This also suggests that stocks with options displaying Volatility Smiles are more speculative in nature at that point in time than stocks displaying a Volatility Skew. This could translate into trading opportunities for speculators or options traders using volatile option trading strategies such as the Long Straddle.
2 Ways To Chart Volatility Smile
Apart from charting the implied volatility of various strike prices on the same expiration date, called the Strike Skew, Volatility Smile can also be charted using the implied volatility of a single strike price across various expiration dates, called the Time Skew. Since both methods are indicative of the future volatility of the underlying asset, charting implied volatility of options based on a combination of both methods produces a 3D known as the Volatility Surface, which provides a more complete picture of the change in implied volatility.
Analysis Using Volatility Smile
Options traders commonly track the Volatility chart of various stocks for the "Evolution of Volatility" over long periods of time. Evolution of Volatility is where volatility charts move from Volatility Smiles to Volatility Skews and vice versa over time. Such movement tells options traders that speculators are beginning to pour into a particular stock when a Volatility Skew evolves into a Volatility Smile. Such information may also be of particular interest to stock traders as well.

|
Don't Know If This Is The Right Option Strategy For You? Try our Option Strategy Selector! |
| Javascript Tree Menu |
Important Disclaimer : Options involve risk and are not suitable for all investors. Data and information is provided for informational purposes only, and is not intended for trading purposes. Neither www.optiontradingpedia.com, mastersoequity.com nor any of its data or content providers shall be liable for any errors, omissions, or delays in the content, or for any actions taken in reliance thereon. Data is deemed accurate but is not warranted or guaranteed. optiontradinpedia.com and mastersoequity.com are not a registered broker-dealer and does not endorse or recommend the services of any brokerage company. The brokerage company you select is solely responsible for its services to you. By accessing, viewing, or using this site in any way, you agree to be bound by the above conditions and disclaimers found on this site.
Copyright Warning : All contents and information presented here in www.optiontradingpedia.com are property of www.Optiontradingpedia.com and are not to be copied, redistributed or downloaded in any ways unless in accordance with our quoting policy. We have a comprehensive system to detect plagiarism and will take legal action against any individuals, websites or companies involved. We Take Our Copyright VERY Seriously!
Site Authored by